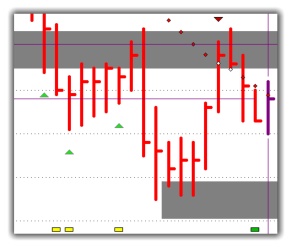
Trend Cluster Tool
Trend clusters are an extension of support and resistance, but applied to trends, rather than highs and lows. Where historical trend lines intersect, we call this a 'trend cluster', and display a rectangular block on the chart to signify this. Trend clusters represent strong areas of resistive price levels. The chart below shows the clusters and the highs/lows features displayed together.
When the price is in the vicinity of a trend cluster, there will be a good chance that price action will retreat from the cluster, on narrowing spreads and a reduction of volume.
If the prices break past the cluster, they will tend to continue in the same direction, until further support or resistance is encountered. There are examples of this sort of thing happening in the chart on the previous page. • In situations where the clusters and the show high/lows feature are displayed at the same price level, one can assume that there is a greater possibility of prices reversing.
Prices can often be seen to meander between a narrow, confined area, such as in the chart below.
On occasion, the price will punch straight through the cluster on a wide spread with significantly increased volume.
When prices are in the vicinity of a cluster, they will normally be extremely resistive to price penetration.